
The Red Flags Nobody Tells You About (Until It’s Too Late)
Excel is amazing. In fact, Excel is so good that millions of businesses run on it way longer than they should.
You start with a simple spreadsheet. Track customers. Add some formulas. Create dashboards. It works beautifully.
Then your business grows. You add more data. More users. More complexity.
And suddenly… things break.
Someone overwrites critical data. You can’t find last month’s version. Multiple people edit the same file and versions conflict. Formulas break because someone moved a column. Reports take hours to generate. You can’t run real-time analytics.
At some point, Excel stops being a solution and becomes a bottleneck.
But how do you know when that point is? And what do you do about it?
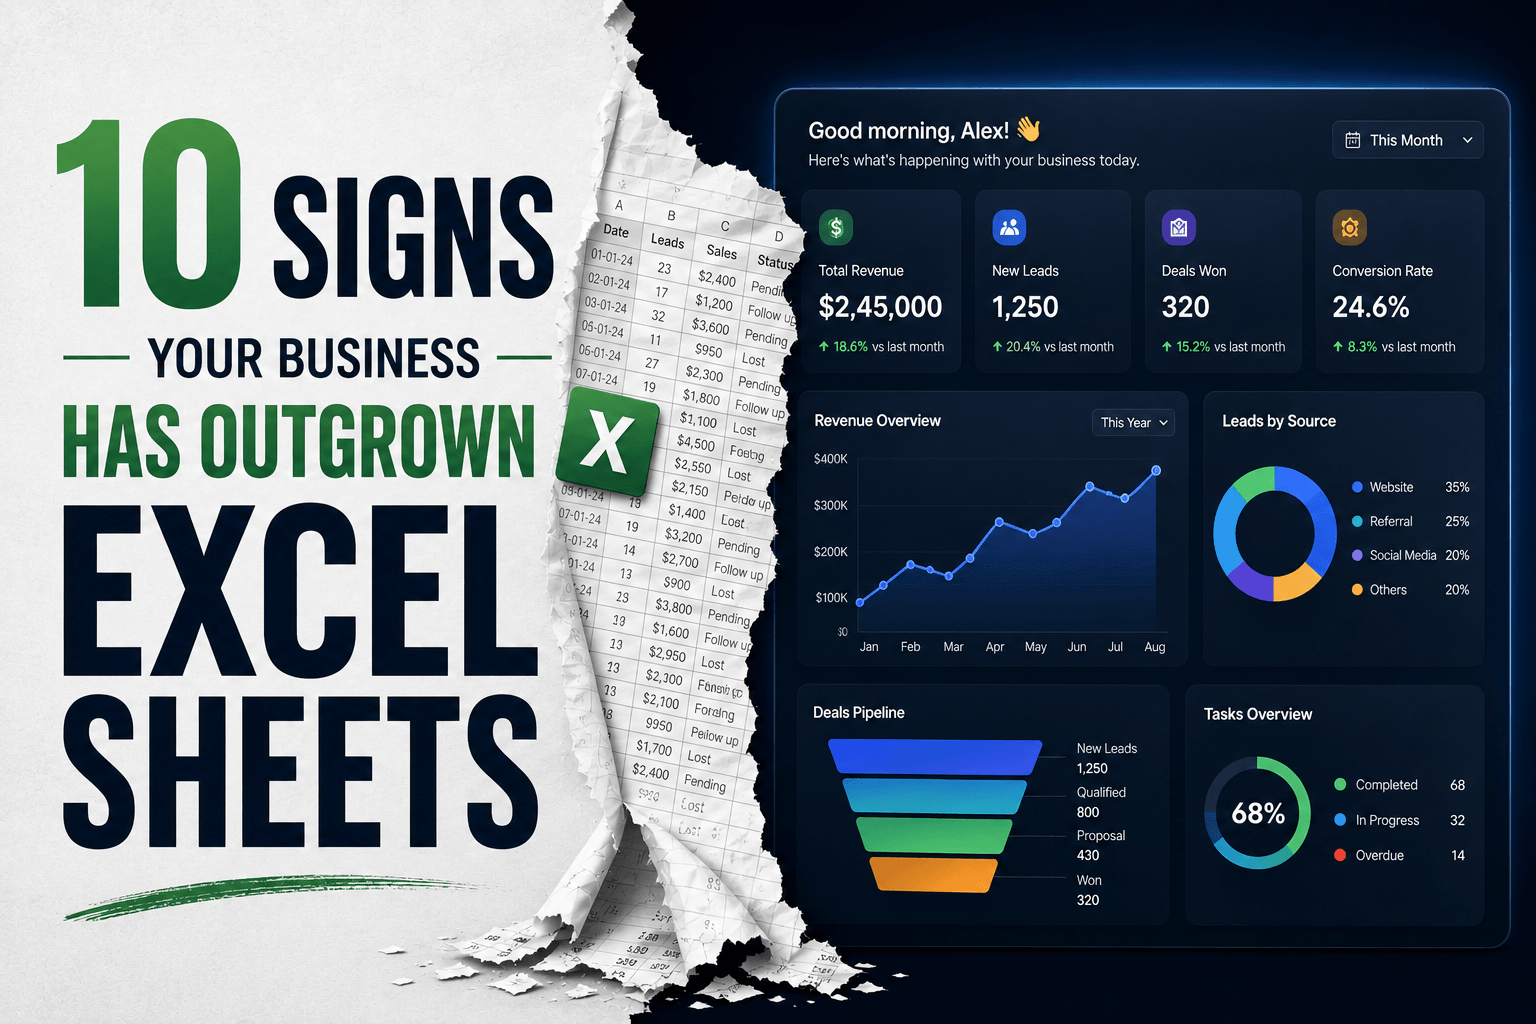
Here are 10 clear signs your business has outgrown spreadsheets.
Sign #1: Multiple People Editing the Same File (And Breaking Things)
The Problem: Two team members open the same file. Both make changes. One saves first. Other person’s changes vanish. You spend hours trying to recover “lost” data.
What it looks like:
Accounting: Two accountants reconciling transactions simultaneously. One’s work overwrites the other’s. Month-end close gets delayed.
Marketing: Multiple team members updating campaign data. Different versions have conflicting information.
HR: Two HR staff adding employee information. New hire’s details disappear.
Why this is a red flag: Excel wasn’t designed for multiple simultaneous users. Real databases handle this automatically. You’re trying to force a single-user tool to work like multi-user software.
What it means: You need software designed for multiple users—CRM, accounting software, HR system, project management tool.
Sign #2: You Have No Idea Which Version is Current
The Problem: Files named: Sales_2024.xlsx, Sales_2024_FINAL.xlsx, Sales_2024_FINAL_FINAL.xlsx, Sales_2024_REAL_FINAL.xlsx
What it looks like:
Sales: Sales pipeline has 5 different versions. Nobody knows if Bob’s version or Sarah’s is accurate.
Operations: Inventory spreadsheet on shared drive has three versions. Finance uses one. Warehouse uses another.
Finance: Budget spreadsheet has versions from January, March, April. Which one is current?
You spend time asking “Is this the latest?” and reconciling different versions.
Why this is a red flag: Version control is critical. Manual versioning fails at scale.
What it means: You need systems with built-in version history and automatic tracking.
Sign #3: Data Entry Is Tedious, Repetitive, and Error-Prone
The Problem: One transaction requires manual entry in multiple places. Errors multiply.
What it looks like:
Sales: Deal closes. Salesperson enters customer info into Excel. Enters deal info. Manually creates invoice. Updates sales pipeline. Updates forecast. Enters commission calculation. 45 minutes per deal. Data entry errors are common.
Accounting: Invoice received. Enters vendor info into payables. Enters amount. Enters due date. Reconciles with purchase order. Entry errors cause payment disputes.
HR: New hire starts. Manually creates email account record. Enters benefits data. Updates salary spreadsheet. Enters start date in multiple places. Inconsistencies happen.
Operations: New product arrives. Enters into inventory. Updates stock levels. Updates reorder point. Updates cost. Errors mean inventory is inaccurate.
Why this is a red flag: Manual data entry scales linearly. Double the volume = double the time = double the errors.
What it means: You need automation. Enter data once. It flows everywhere automatically.
Sign #4: You Can’t Answer Basic Business Questions Quickly
The Problem: Simple questions require investigation time.
What it looks like:
Sales: “How many deals are in pipeline?” You need to open Excel. Run formulas. Wait for calculation. Still not 100% confident the answer is right.
Finance: “What’s our cash position?” Need to check multiple spreadsheets. Reconcile numbers. Wait for formulas. Answer takes 20 minutes.
Marketing: “Which campaign is performing best?” Need to pull data from Excel. Create formulas. Build charts. Takes an hour.
Operations: “Which products are running low?” Need to open inventory sheet. Review stock levels. Takes 15 minutes to answer.
HR: “How many employees do we have by department?” Should be instant. Instead, need to manually count.
Different people give different answers. Meetings turn into debates about whose number is right.
Why this is a red flag: Basic business questions should have instant answers. If not, your data infrastructure is broken.
What it means: You need dashboards that update automatically and show real-time answers.
Sign #5: Monthly/Weekly Reports Require Hours of Manual Work
The Problem: Reports that should be automated require hours of manual labor.
What it looks like:
Accounting: Month-end close ritual: Pull trial balance from accounting system into Excel. Pull expense report from expense tool. Manually reconcile. Create summary. Build variance analysis. Make charts. This takes 6 hours. Reports are usually 2-3 days late.
Sales: Weekly pipeline report: Pull data from three different sources. Consolidate into master Excel. Create visualizations. Email to leadership. 3 hours every Monday. If numbers are wrong, nobody knows until next week.
Marketing: Campaign reporting: Pull data from email platform, ad platform, website analytics. Manually compile into Excel. Create performance summary. Takes 4 hours. Data is 3 days old by the time it’s ready.
Finance: Cash flow reporting: Pull bank data. Pull receivables. Pull payables. Consolidate. Project forward. Takes 5 hours. By the time it’s done, the week has changed.
HR: Headcount and hiring pipeline reporting: Pull from multiple spreadsheets. Consolidate. Create forecast. Manual process takes 3 hours.
Why this is a red flag: Reports should be automatic. If you’re manually pulling and consolidating data every week/month, something is broken.
What it means: You need systems that automatically track data and generate reports.
Sign #6: Security Is Out of Control
The Problem: Critical business data is exposed with minimal controls.
What it looks like:
- Finance: Sensitive financial data in unencrypted spreadsheets. Anyone with folder access sees everything. No audit trail of who accessed what.
- Sales: Customer list with sensitive pricing data. No granular permissions. Entire dataset accessible to everyone.
- HR: Employee data (salary, SSN, performance reviews) in shared spreadsheet. No security. No controls.
- Operations: Supplier information and pricing. Accessible to everyone including contractors.
Real situation: Employee leaves company. Downloads customer data or supplier list. Now they’re your competitor with your customer information.
Why this is a red flag: Excel has no security. No audit trail. No data encryption. No granular permissions.
What it means: You need proper database software with security controls, encryption, and access logs.
Sign #7: You’re Manually Tracking Things That Should Trigger Alerts
The Problem: You manually check for conditions that should automatically notify you.
What it looks like:
- Sales: Deal hasn’t moved in 30 days. Someone needs to manually check and follow up.
- Accounting: Invoice 15 days overdue. Someone manually reviews aged receivables.
- Operations: Inventory below reorder point. You need to manually check daily and reorder.
- HR: Employee’s annual review is due. Manually tracked. Easy to miss.
- Finance: Budget has been exceeded on category. Manual review catches it weeks later.
- Customer Service: Customer hasn’t purchased in 6 months. Nobody automatically reaches out.
With Excel, you either manually check these conditions or create complex formulas. Both are inefficient.
Why this is a red flag: These should trigger automatic notifications. You shouldn’t need to manually check.
What it means: You need workflow automation. When conditions are met, automatic alerts fire.
Sign #8: Different Departments Have Their Own Spreadsheets (Data Doesn’t Match)
The Problem: No single source of truth. Data fragmentation is chaos.
What it looks like:
Customer data: Sales tracks customers in their spreadsheet. Customer service tracks them differently. Finance has their own customer list. Three different customer IDs for the same person. Names spelled differently. Addresses that don’t match.
Product data: Operations maintains inventory in one spreadsheet. Finance tracks different numbers. Sales tracks different units. Nobody knows the truth.
Employee data: HR has the official employee list. Finance has payroll spreadsheet (different format). Operations has access spreadsheet. All have different numbers.
Financial data: Accounting has one version of revenue. Sales has another. Finance dashboard shows third version. CFO doesn’t know which is right.
When Finance asks “Do we have an invoice for customer X?” the answer depends on which spreadsheet you check.
Why this is a red flag: Data fragmentation creates chaos. Decisions based on conflicting data.
What it means: You need centralized database everyone uses as single source of truth.
Sign #9: Excel Is Slowing Down Because of Data Volume
The Problem: Excel was designed for thousands of rows. You have hundreds of thousands.
What it looks like:
Sales: Customer database started with 100 rows. Now 50,000. Spreadsheet opens slowly. Formulas take forever to calculate. Adding new records is sluggish.
Finance: Transaction history with 200,000+ rows. Excel struggles. Creating pivot tables crashes the program.
Operations: Daily transaction log with millions of entries. Excel simply can’t handle it.
Marketing: Lead database with 100,000+ records. Opening file takes 2 minutes. Filtering takes forever.
Why this is a red flag: Excel has limits. You’re hitting them.
What it means: You need actual database software that handles large data volumes.
Sign #10: You’re Making Business Decisions Based on Data You Don’t Trust
The Problem: The most serious sign. You don’t have confidence in your data.
What it looks like:
Finance: “What’s our profitability?” You check Excel. But you’re not 100% sure it’s accurate. You ask three other people if they trust this number. Nobody is confident.
Sales: “What’s our pipeline?” The number keeps changing. You don’t know if it’s real growth or data entry issues.
Operations: “What’s our inventory position?” You don’t trust the numbers because you know they’re often wrong.
Marketing: “What’s our customer acquisition cost?” Depends on which spreadsheet you look at.
HR: “How many open positions do we have?” The number changes depending on who you ask.
The real problem: You’re flying blind. Data should give confidence. If you don’t trust your data, you can’t make good decisions.
Why this is a red flag: You’ve outgrown the tool that’s supposed to support your decision-making.
What it means: You need systems where data accuracy is guaranteed and auditable.
What Happens After You Outgrow Excel
If you ignore these signs:
- Inefficiency increases (more time on manual work)
- Errors multiply (bad data, wrong decisions)
- Growth slows (you’re limited by tool capacity)
- Employee frustration rises (tedious work, confusion)
- Customers suffer (slow responses, wrong information)
If you upgrade to proper tools:
- Manual work decreases (automation handles it)
- Data accuracy improves (single source of truth)
- Growth accelerates (no tool-related bottlenecks)
- Employees are happier (less tedious work)
- Customers get better service (faster, more accurate responses)
What Should Replace Excel?
The answer depends on your type of business:
For Sales/Customer Management: CRM software (tracks customers, deals, interactions)
For Accounting/Invoicing: Accounting software (tracks money, creates invoices, reconciles)
For Project Management: Project management tools (tracks tasks, timelines, dependencies)
For General Business Data: Database software or low-code platforms (build custom solutions)
Most businesses need 2-3 integrated tools, not one does-everything solution.
Your Action Plan
If you have 1-2 of these signs: You’re okay for now. But think about timeline.
If you have 3-4 of these signs: Start researching alternatives. No rush, but plan for next 6 months.
If you have 5+ of these signs: You need to move off Excel within next 3 months. Every day you wait costs you efficiency and introduces risk.
Next steps:
- Identify which tools you need
- Research options (read reviews, talk to users)
- Plan migration from Excel
- Train team on new system
- Monitor adoption and results
The Real Cost of Staying on Excel
Time spent managing Excel:
- Data entry: 10 hours/week
- Fixing errors: 5 hours/week
- Creating reports: 5 hours/week
- Resolving version conflicts: 3 hours/week
- Training new people on your system: 2 hours/week
Total: 25 hours per week = 1,300 hours per year
That’s a full-time person. Every year. Just managing Excel.
Move to proper tools? You cut that in half or more.
The Bottom Line
Excel is a crutch. It works at small scale. When you outgrow it, you don’t need a better crutch. You need to stand on your own.
If you’re experiencing these signs, you’re trying to operate a growing business on a tool designed for personal finance tracking.
The question isn’t “Should we get rid of Excel?” It’s “How fast can we transition to tools that support our business?”
Every day you wait, you’re leaving efficiency, accuracy, and growth on the table.




Related Posts
Uncategorized
Uncategorized
Uncategorized